Data Science in Freight Transportation
Dr. Chris Caplice, a senior research scientist at MIT and a chief scientist at DAT Freight & Analytics, talks about how data science is transforming the transportation industry.
Here’s summary of how shippers/3PL can use data-driven insights to answer four key questions and make proactive, informed decisions.
Truckload Transportation Summary
The market is huge
- $700B in 2020 (3% of GDP)
- 1,000,000 shippers
- 100,000 carriers
- 10,000 intermediaries
Networks are complex
- Wide range of different lanes
- Little overlap on lanes
- Less than 5% of a shipper’s network is showing up in another shipper’s networks
- Many lanes don’t repeat
- A lane that has less than 12 loads per year will not be there next year
Every shipment is full of data
- Continuous communication
- EDI, API
- Temporal and spatial changes
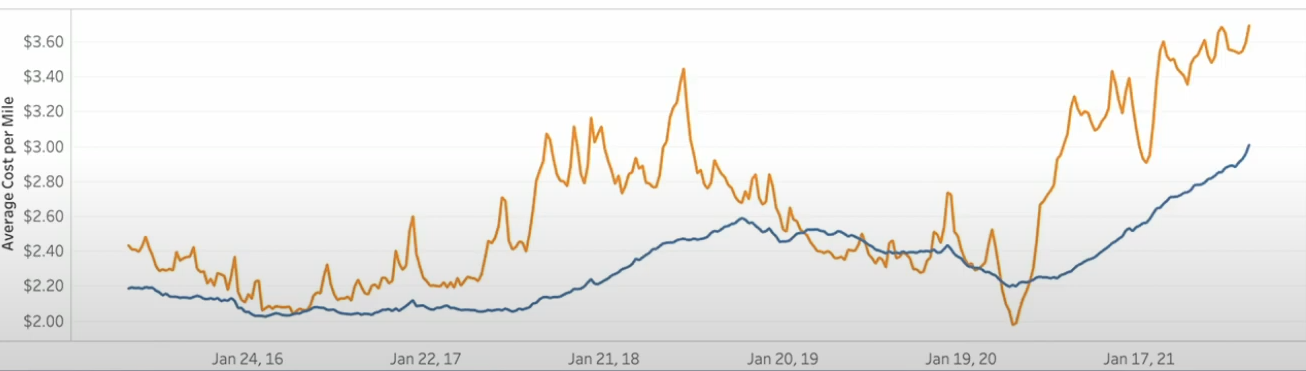
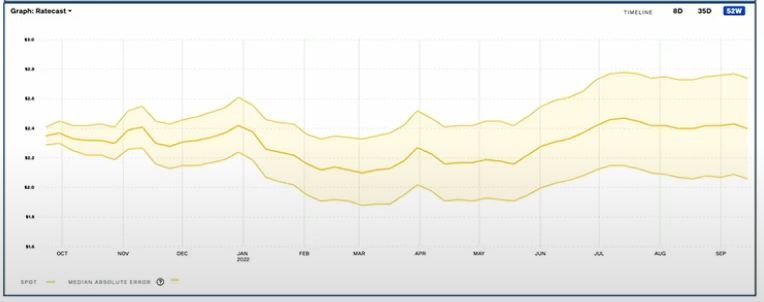
Spot vs. Contract rates
Spot Rates
- Like “weather”: day-to-day state of the atmosphere
- fluctuating
- Yellow line
Contract Rates
- Like “climate”: weather over a long period of time
- stable
- Blue line
- Notice Spot rate rises first and Contract rate lags a little bit and rises afterwards
4 key questions answered by data Science
Descriptive: What happened in the past?
Knowing what happened in the past is particularly important when it comes to 3PL, where high variability at any given time can make it hard for shippers to predict the future.
With data science, you can:
- Break down lane rates into contract and spot over a set period of time.
- Further break down the market contract rate to see what the rate was for certain types of loads (FTL, LTL), trucks (Dry Van, Reefer, Flatbed), etc.
You ask questions like:
- How did contract rates differ for this lane by different shippers
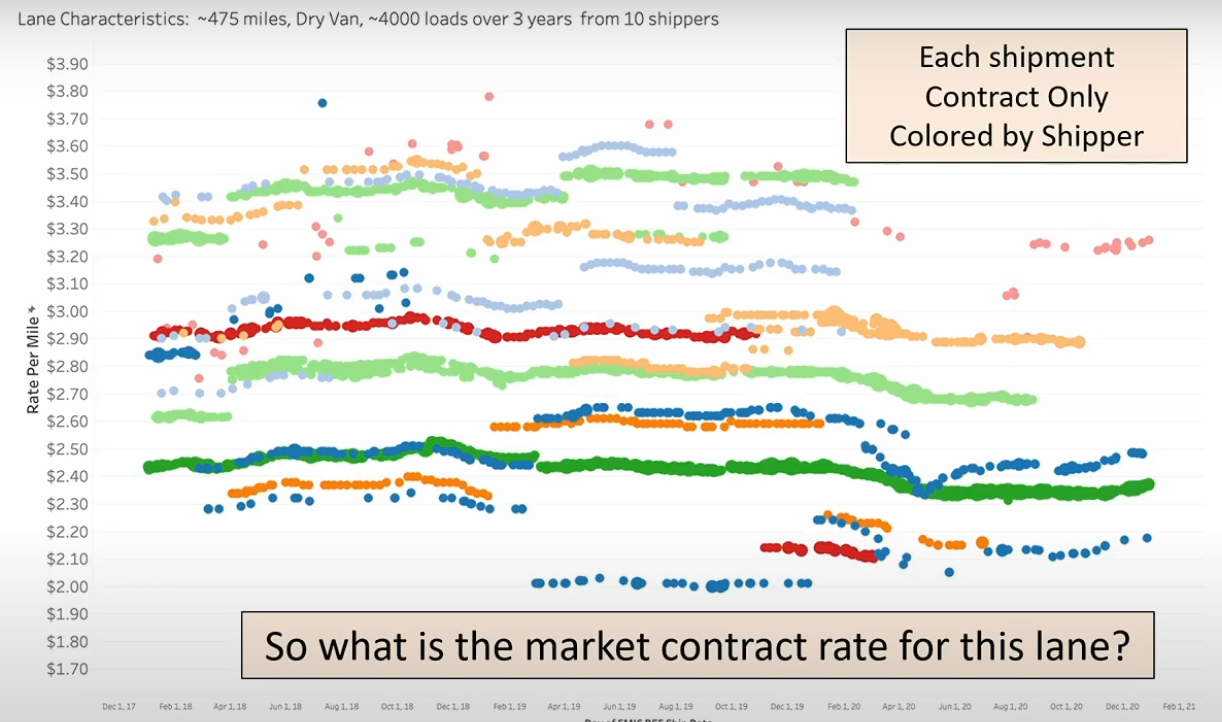
Diagnostic: Why did this happen?
Once you figured out what happened, you want to find out why.
- Did something cause past behavior?
- Can you change it for the better?
Understanding the underlying issues from the past helps you address them proactively for the future.
Lane rate can vary widely based on a number of factors including distance, equipment type, lane characteristics, macro-economic conditions at the origin and destination, difference between forehaul vs. backhaul rates, etc.
With data science, you can:
- understand how lane works
- estimate a contract rates
- monetize the impact of different factors
- gain new insights to adjust your approaches in the future
You ask questions like:
- Why do these rates differ so much
- The truckload lanehaul cost is a function of:
- Equipment type (Reefer, Dry Van, Flatbed)
- Distance
- Macro-economic conditions at origin and destinations
- Lane from Chicago-Miami is more expensive than from Miami-Chicago
- Lane characteristics
- A lane with steady state freight vs. lane with high variability
- Shipper behavior
- If you have bad payment term or dwell time, you are likely to pay higher rates
- Why was the light blue lane paying higher contract rates?
- May be that shipper had bad payment term or dwell time
- The truckload lanehaul cost is a function of:
Inbound vs. Outbound Regional values
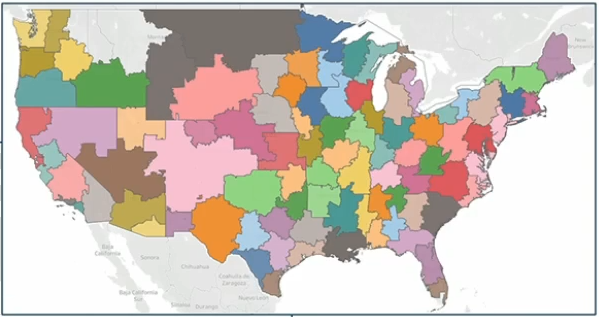
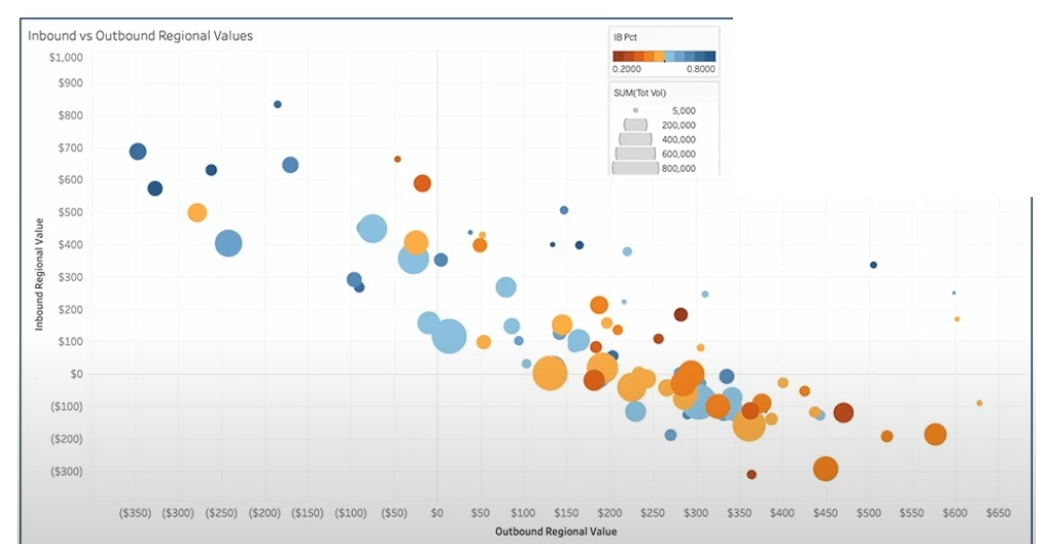
- Size: # of inbounds or outbounds
- Color: The bluer, the more inbounds to the region. The redder, the more outbounds in the region.
- The region in LA is red because there are a lot of stuffs that come out of the port to get distributed throughout the states.
- Regional values are stable over time – very little relative change
- useful in network design and facility location
- This is very similar to what I did for a side project on Seoul bike trips to cluster counties by their inbound-outbound ratio by time!
Segmenting lanes by demand behavior
- Demand Cadence
- frequency of demand by weeks
- Demand variability
- how variable is demand when it materializes
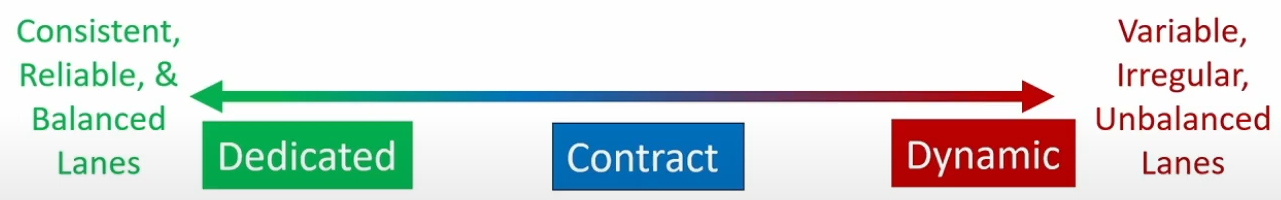
Spot/Dynamic Rates
- fluctuating
- Price is determined at the time of the transaction like Spot rates
- Recently, more shippers are starting to move into dynamic procurement
- It’s up to business strategy whether you want to procure spot/dynamic rates to give yourself flexibility to go with the market rate or push everything to contract as much as possible and only use dynamic only when things fail
- Data science allows you to separate those by analyzing characteristics for a specific lane
Predictive: What is most likely to happen in the future?
With data science, you can:
- forecast contract or spot rates by including potential explanatory variables
- shift from lane-level forecasts to shipment-specific forecasts, giving you more control with a specific load
- e.g.) Predict churn (bounce load)
- Customer Churn: Customer ends relationship with the shipper
- Carrier Churn: Carrier does not show up for pickup
- Can we identify customer/carrier churn ahead of time?
- Combined with human judgment, data science can help shippers identify customers and carriers at risk of churn (likely to bounce), so they can then take proactive steps to keep them engaged.
####
Prescriptive: What actions should be taken?
Once the data has been analyzed and data science has offered predictions for the future, it can offer some possible actions to maximize positive outcomes. This is where human judgment
- Bounce Load Project can be utilized to provide warnings for loads that are likely to bounce, so that sales reps can take proactive actions (checking with high-risk carriers more often via phone call) on those loads. It’s not taking away decisions from humans but providing extra information to them to make more informed decision.
- While predictive models may identify customers and carriers at greatest risk of churn and even offer some possible actions to take, it’s up to the shipper to decide, first, if they’d rather have false positives or false negatives mixed in with that data and, second, what specific intervention to take with each customer or carrier.
Reference
- https://www.youtube.com/watch?v=XrwzEX8UHPI