[Seoul Bike] 01. Bike Station EDA
Intro
The city of Seoul has recently released a gigantic amount of open data. Out of all of them, I was most familiar with and interested in the Seoul bike (a.k.a Ddareungi, pronounced “tha-reung-ee”) data set.
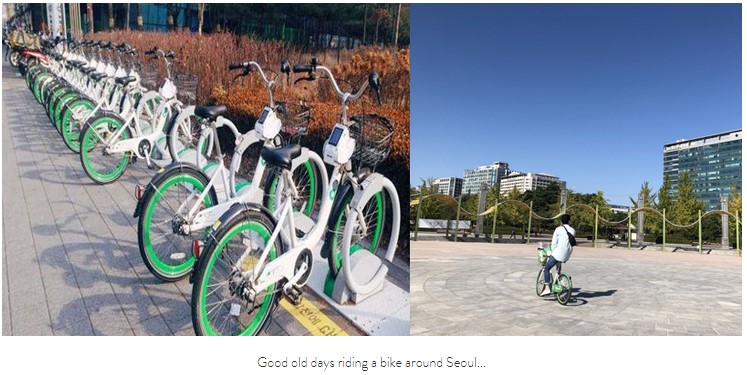
Fun fact: Anyone can rent a bike for $1 per hour anywhere in Seoul!
I have always had a great time riding bikes around Seoul and would love to do an in-depth EDA on it. I might be able to share some trivia with my friends that I found from this analysis.
I have a few ideas which I can’t cover them all in just one post, so please stay tuned for the next episodes to come :)
Data
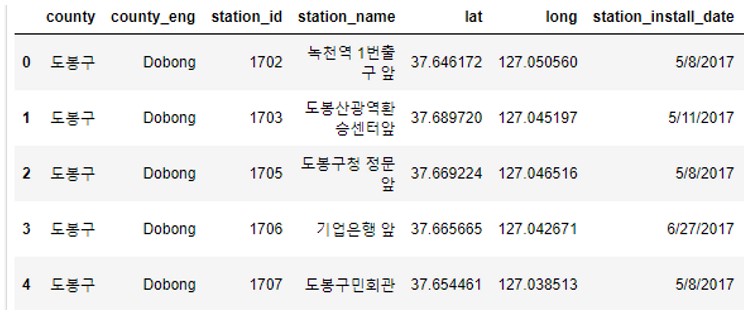
In this post, I will be looking at the bike stations installed across the city of Seoul. You can see the data set (Total # = 2154) below:
EDA
Visualizing Bike Stations in Seoul
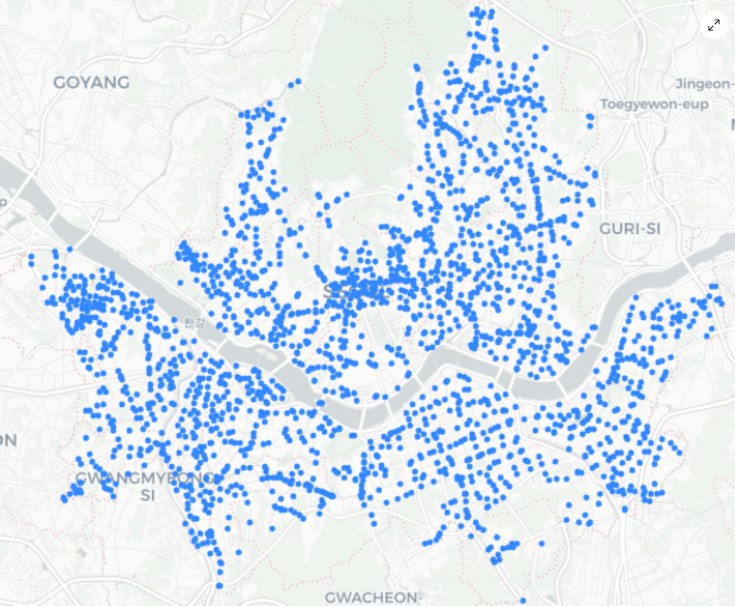
It seems like the stations are widely spread out but clustered at certain areas.
Let’s look at a heat map.
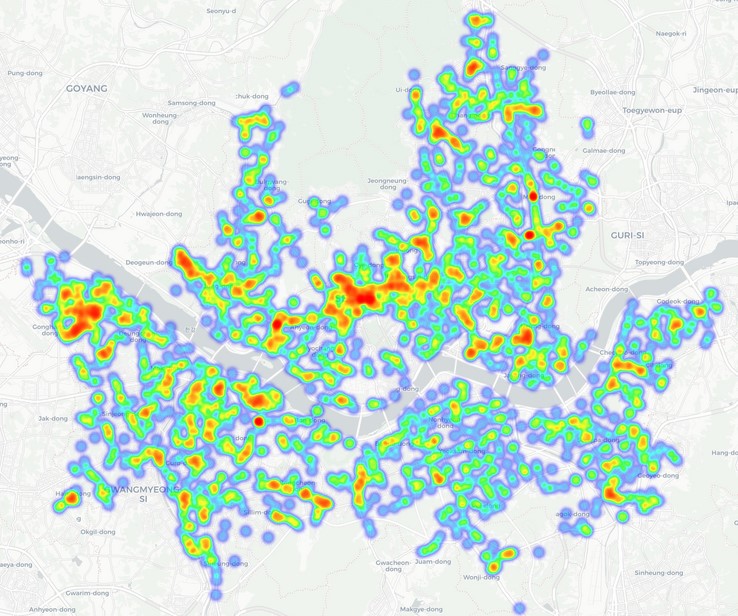
The center (Jongno, Jung) seems to have a high density of stations compared to other areas. That’s where a variety of companies are located as well as some museums.
Visualizing by County
- Number of Stations by County
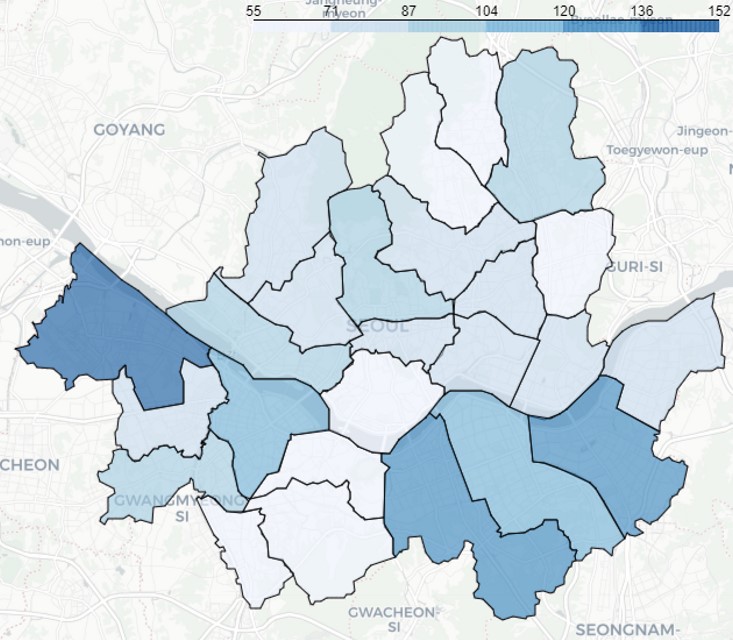
The darker the color, the more stations are located in that county.
The South-East (Gangnam, Songpa, Seocho) and the West (Gangseo) seem to have comparatively more stations. Gangseo has recently finished big construction projects (building new apartments and parks), which attracted many residents. Also, LG has recently moved their office and labs to Gangseo right next to the botanical park.
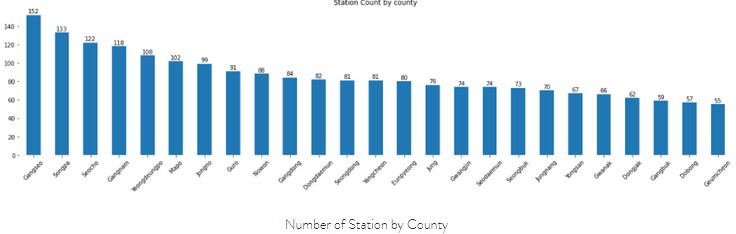
Putting it into numbers,
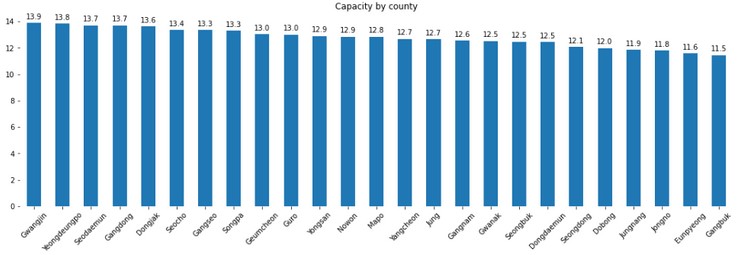
- Capacity of Stations by County
There are many parking spaces per station, so let’s look at the capacity of the bike stations by county.
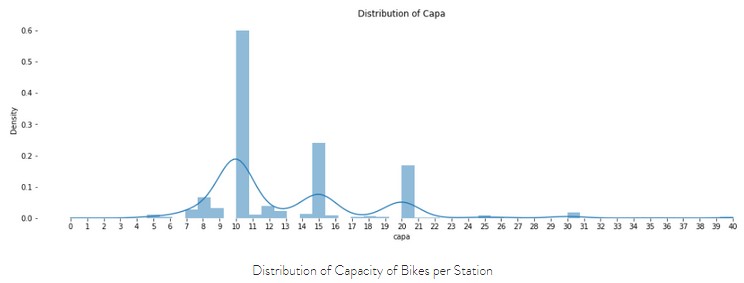
In general, stations with 10 parking spaces are the most common, and stations with 15 and 20 are the next most common.
There are big stations with 30 and 40 spaces.
Now, let’s get back to a map showing the average capacity of bike stations by county:
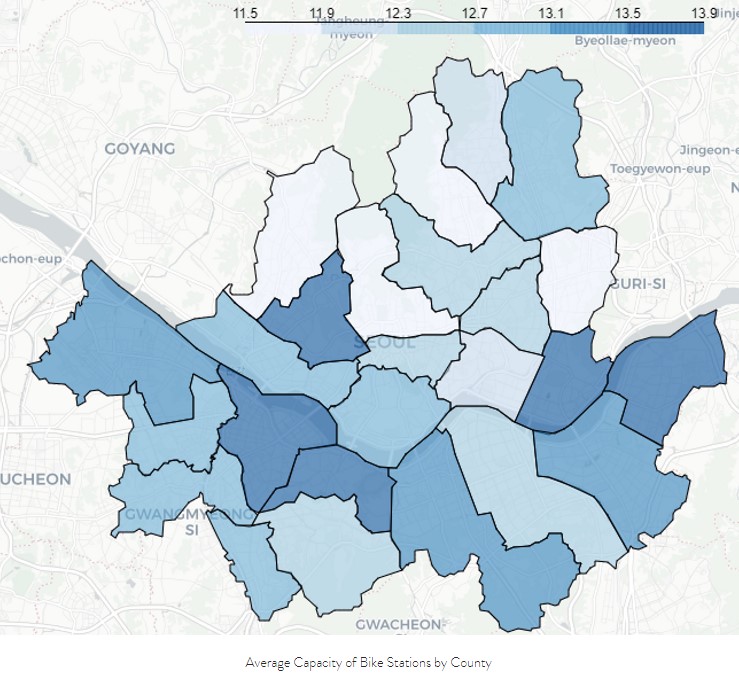
The darker the color, the more capacity the county has.
I understand it could be hard to tell which county is which on the map if you don’t know Seoul really well, but Yongsan (the very center county) has a relatively small number of bike stations, but the capacity is high. In other words, there are more bikes per station in Yongsan.
Numerically, we can see:
There isn’t much difference in capacity by counties.
- Distance to the Closest Station by County
Let’s now look at how far one station is located from the next nearest station.
If stations are clustered, the average distance will be small.
If stations are scattered apart, the average distance will be large.
Let’s first check the distribution of distance between stations.
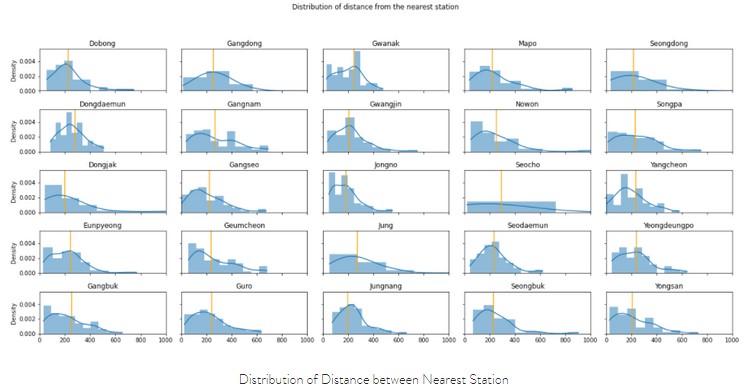
The orange line indicates the average distance between stations of each county.
The nearest distance between two stations mostly fall in the range of 100m - 300m.
Notice something bizarre?
Seocho has a flat distribution!
Let’s dig into it.
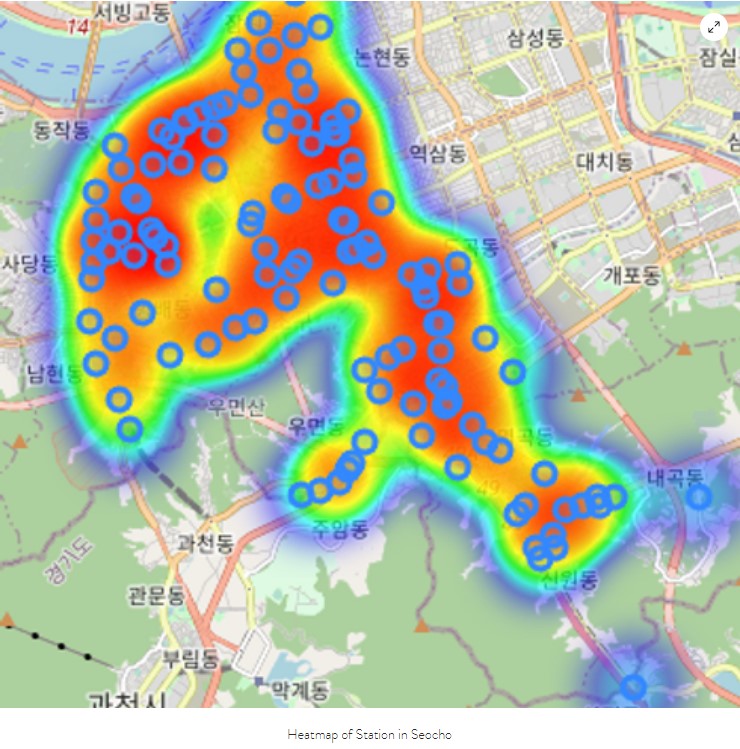
There are stations (bottom right corner) that are located very far from the other clusters in Seocho.
Back to the average distance between nearest stations:
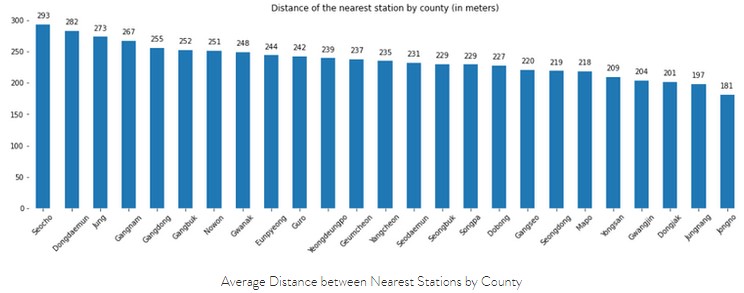
The average distance between nearest stations falls in the range of 180~300m.
Seocho had the largest average distance between stations which is due to the stations/outliers that are extremely far from other stations.
Jongno, which had a high density of stations in our heat map, has the smallest average distance (most clustered) between nearest stations.
Summary
Bike stations are well distributed throughout the city. They are relatively more dense in the center of Seoul (Jongno, Jung)
The South-East (Gangnam, Songpa, Seocho) and the West (Gangseo) have comparatively more stations. The county with the greatest number of stations (Gangseo; 152 stations) had nearly three times as many as the county with the fewest (Geumcheon; 55 stations).
Average capacity of stations by county didn’t vary significantly and fell in the range of 11~14 parking spaces per station.
The average distance between nearest stations is in the range of 180~300m, while Jongno having the shortest average distance at 181m.
In the next episode, let’s look at trip data!