[Finance] Technical Analysis Tool using Shiny
The two main stock investment analyses are fundamental and technical analysis. Fundamental analysis determines the health and performance of an underlying company by looking at key numbers and economic indicators. On the other hand, technical analysis looks at the price action and volume of a stock to predict its next move.
Technicians use a combination of graphing methods and technical indicators to decide whether to buy or sell a stock. Although there are probably a few applications for the technicians, I thought building one for myself would be cool to refer to when I start investing or just for the fun of building an app! So I immediately put my ideas into action.
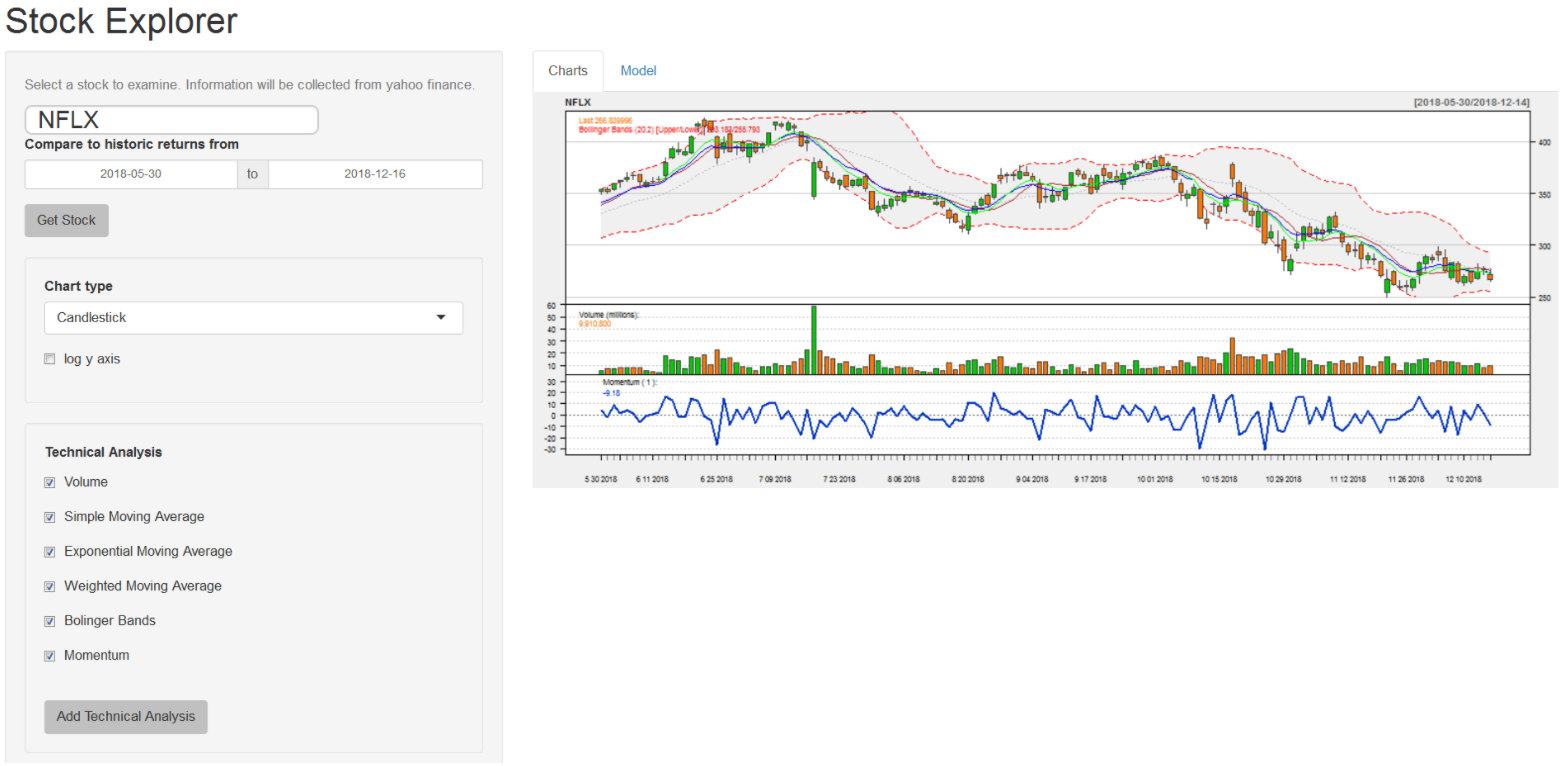
For the shiny application that I made, you can:
Pull up a specific stock price chart with the help of auto completion
Add different technical analysis (Bonlinger Bands, Weighted Moving Average, Momentum, etc.) on the chart
Select chart type
Build the stock’s daily return model with different mean and standard deviation.
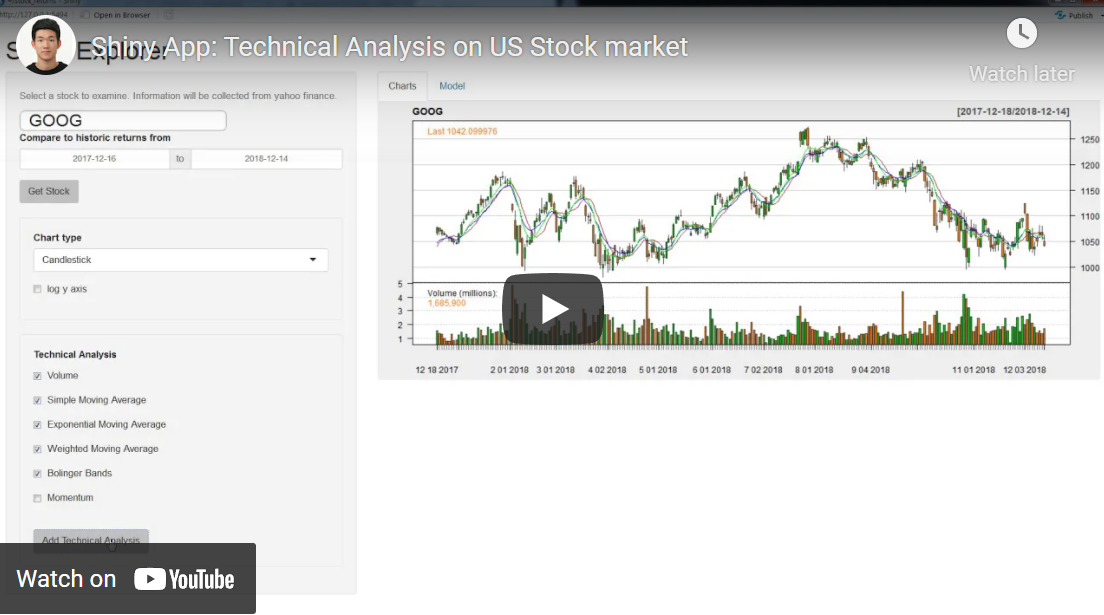
Below is the video of the shiny application:
Key Functions
- Auto completing stock code
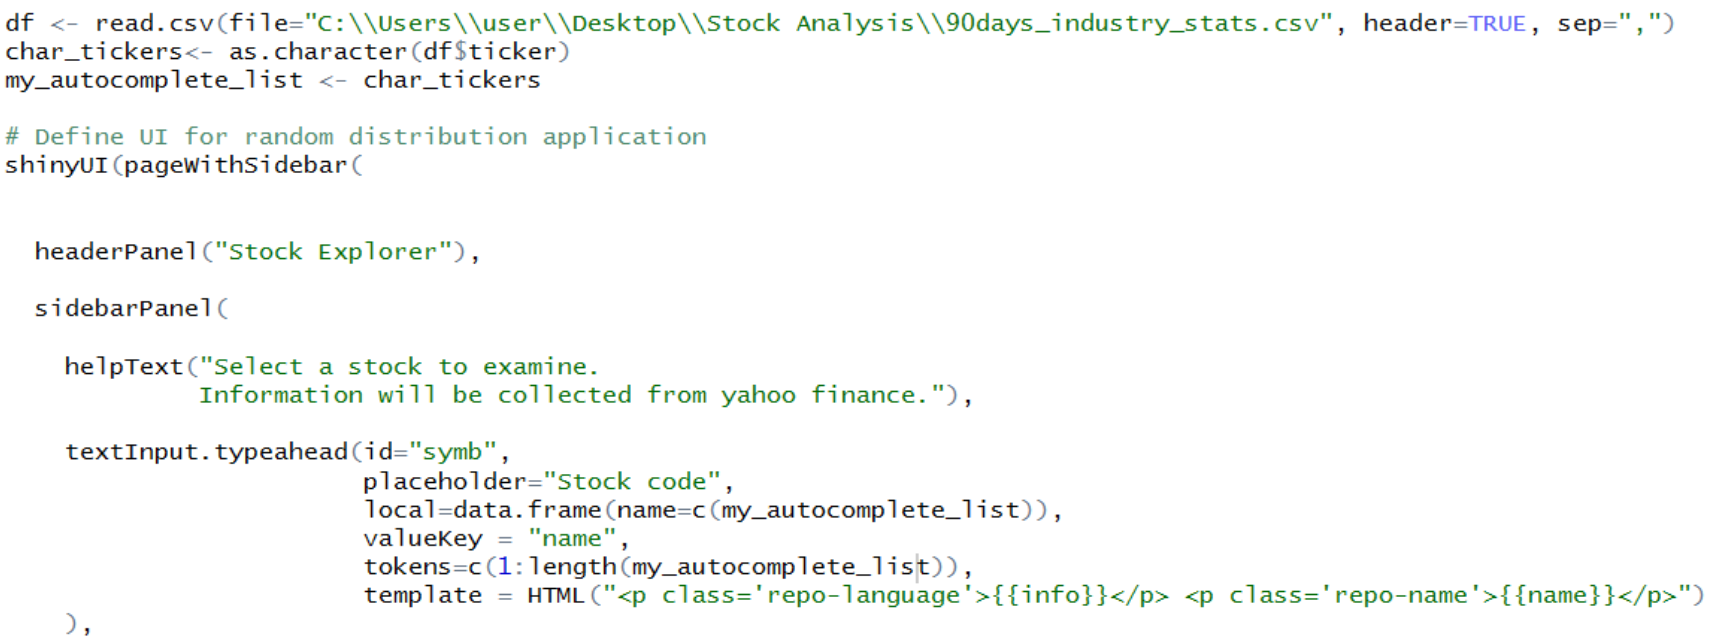
I first had to download a csv file with tickers. I used a function “textInput.typeahead” with a packages called “shinysky”.
- Adding technical analysis
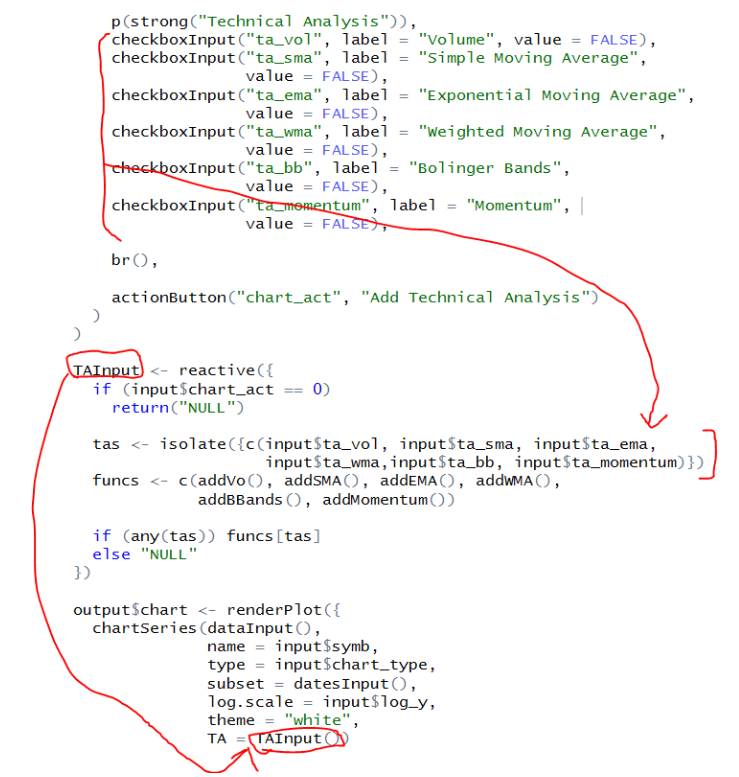
The “quantmod” package allows displaying a price chart of a stock as well as adding technical analysis on the same chart. I just had to create a check box for users to select the technical analysis options.
Conclusion
Well, it was quiet fun exploring packages like quantmod and shinysky. Quantmod is widely used by R users for stock analysis. If time permits in the future, I would like to develop a back-testing tool that compares numerous stocks on different dimensions, allows users to simulate their investment, and shows how much they would have earned if they invested $xxxxx in X,Y,Z stocks for xx many years.