[Internship] QA Data Analyst Internship Project: SE’s Bug Fix Performance (feat. Power BI)
Introduction
As I said in the previous post, I worked as a data analyst intern in the QA team at a game-making company. As the name Quality Assurance suggests, QA team primarily deals with two tasks:
- Test runs
- Bugs
I was curious to know how efficiently Software Engineers were fixing bugs relative to each other. So I took the initiative to create a Powerb BI dashboard that tracks SE’s bug fix performance.
Goal
The potential beneficiary of information about SE’s bug fix performance is the SE Team Lead. The expected benefits are as follows:
- Considering the characteristic of the bug, SE Team Lead will be able to assign a bug to the most competent SE, resulting in better bug fix rate
- In performance appraisal, SE Team Lead can make a more objective evaluation of SE’s competence in fixing bugs
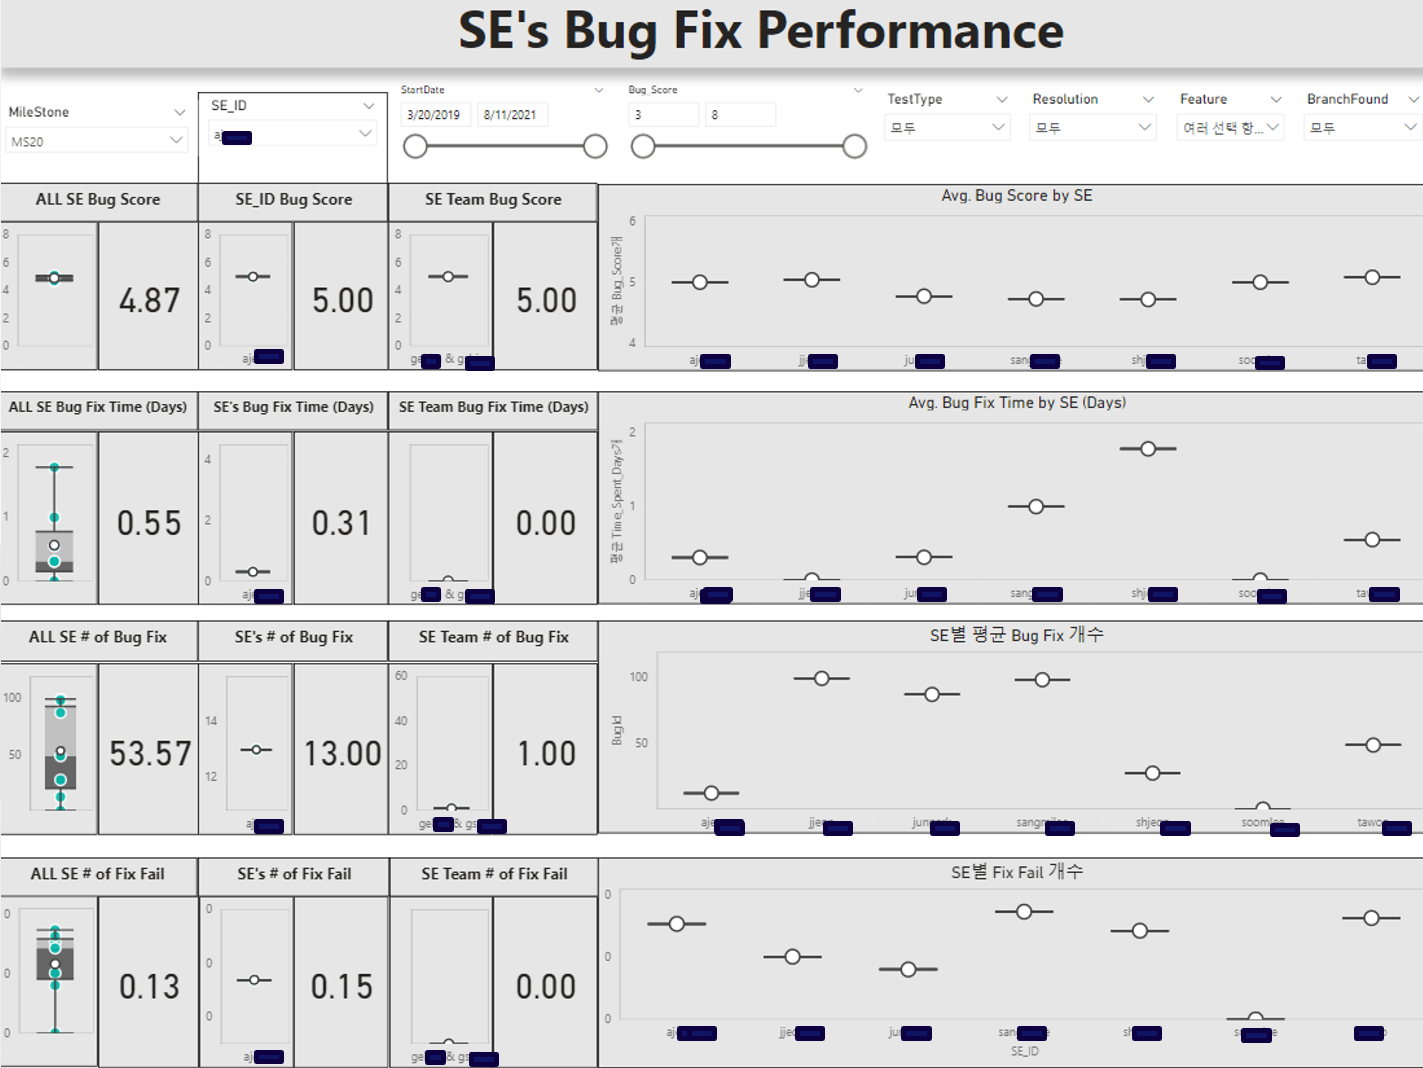
We can compare the bug fix performance by all SEs vs. SE vs. SE Team. Again, bug fix performance is measured by 4 KPIs:
- Average number of bugs fixed per SE
- Average time taken per bug fix
- Critical impact of bugs
- Bug Fix Fail Rate
This page can be utilized:
- If SE Lead wants to compare how his SE team performs compared to all SEs or if he wants to compare how a specific SE performs compared to the team or overall SEs.
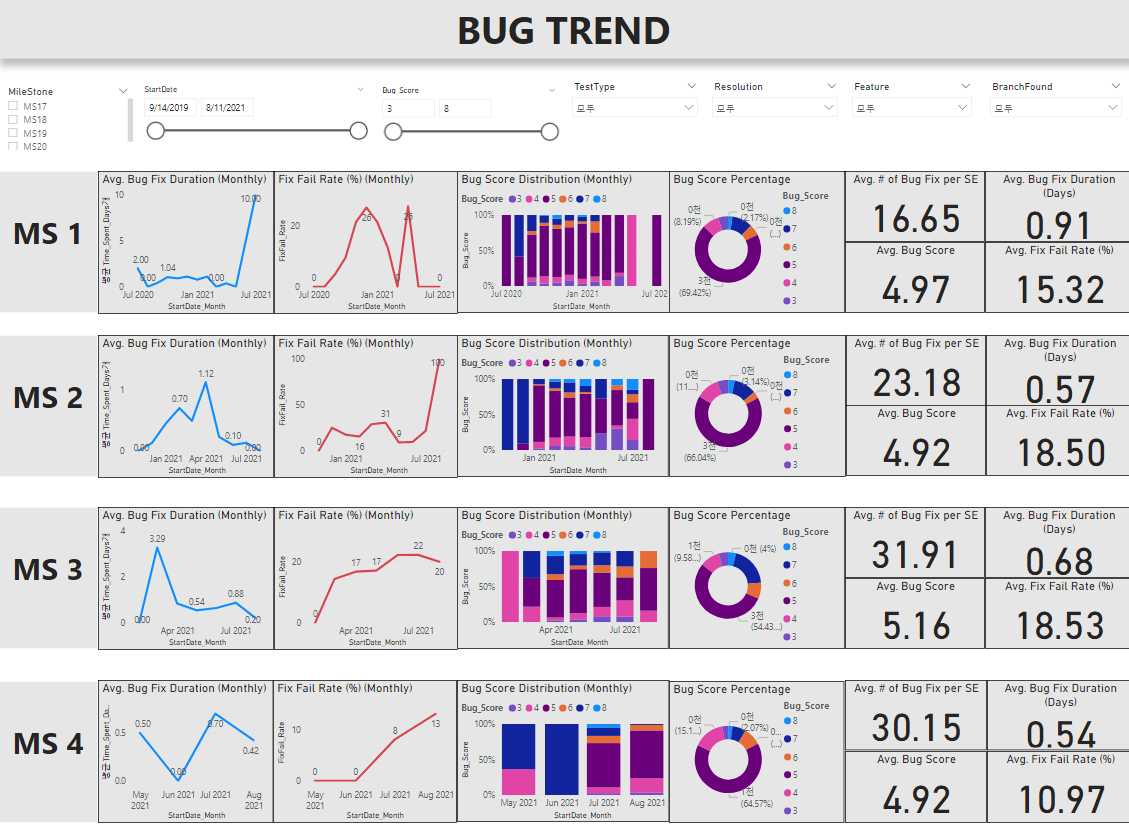
This page displays the overall Bug Fix Performance by each milestone. The Bug Fix Performance is evaluated by the following KPIs:
- Average number of bugs fixed per SE
- Average time taken per bug fix
- Critical impact of bugs
- Bug Fix Fail Rate This page can be utilized:
- MS 1 vs. MS 3
- If the average number of bugs fixed per SE increased from 16.65 to 31.91, we can infer that either more bugs occurred in MS 2 or the overall SE capacity decreased in MS 2. Such inference will lay a stepping stone for further analysis into what really cause the increase in the average number of bugs fixed per SE
Lesson Learned
- It was a great opportunity to think from a client perspective and ponder about ‘What would I want to see if I am a SE Lead?’, ’What visualization should I use for group comparison?’, ‘How can I make a simple dashboard that contains all the key information?’